BiziTopics
Email Analytics That Matter: How To Track, Measure & Optimize For Results
BiziBusiness
Jul 8, 2025
16 min read
Most marketers are drowning in email data—open rates, click rates, subscriber counts, A/B test results—and yet still unsure what’s actually working. That’s because not all metrics matter equally. Some are directional. Some are deceptive. And a few are truly decisive when it comes to driving revenue and retention.
Open rate, for example, used to be a go-to KPI. But with Apple Mail Privacy Protection and similar updates, opens have become less reliable as a measure of user interest. Meanwhile, metrics like click-to-convert rate or revenue per recipient get far less attention—despite having a direct line to business impact.
The truth is: measuring what matters means shifting focus from vanity stats to performance drivers. When you understand the right metrics—and how they connect to your brand’s goals—you stop guessing and start optimizing with intent.
This guide will help you break down the noise, focus on meaningful KPIs, and build an analytics strategy and planning that actually fuels smarter campaigns, not just prettier reports.’
The Foundation – Email Metrics 101
Before you can optimize your email performance, you need to understand the building blocks of email analytics—and more importantly, how to separate useful insights from surface-level stats.
The Four Core Categories of Email Metrics
All email metrics fall into one of four strategic categories:
- Delivery Metrics – Measure if your emails actually land in inboxes (e.g., bounce rate, spam complaints, deliverability rate)
- Engagement Metrics – Track how recipients interact with your content (e.g., open rate, click-through rate, click-to-open rate)
- Conversion Metrics – Reveal whether your emails drive meaningful actions (e.g., purchases, signups, downloads, revenue per email)
- List Health Metrics – Monitor the long-term value and viability of your list (e.g., unsubscribe rate, inactive subscribers, list growth/decay)
Each group serves a different purpose. Together, they give you a complete view of how your campaigns are performing—and where to focus your optimization efforts.
Metric vs. KPI: Know the Difference
Not all metrics are Key Performance Indicators (KPIs). Metrics are data points. KPIs are decision-making tools. The difference lies in context and relevance.
- Metric example: Open rate = 34%
- KPI example: Campaign A had a 34% open rate and a 5.8% revenue lift—this helped validate the new offer strategy.
A metric becomes a KPI when it’s tied to a business goal—like increasing purchases, reducing churn, or improving subscriber retention.
Beware of Blind Benchmarks
Is a 20% open rate good? What about a 2% click rate?
The truth is benchmarks are only meaningful when they match your audience, industry, and campaign type. A SaaS nurture email, an eCommerce flash sale, and a nonprofit donation appeal will all have different “norms.”
Use benchmarks to set baselines—but lean into your own performance history to define success. Your past campaigns are your most reliable benchmark.
Top-of-Funnel Metrics – Attention and Interest
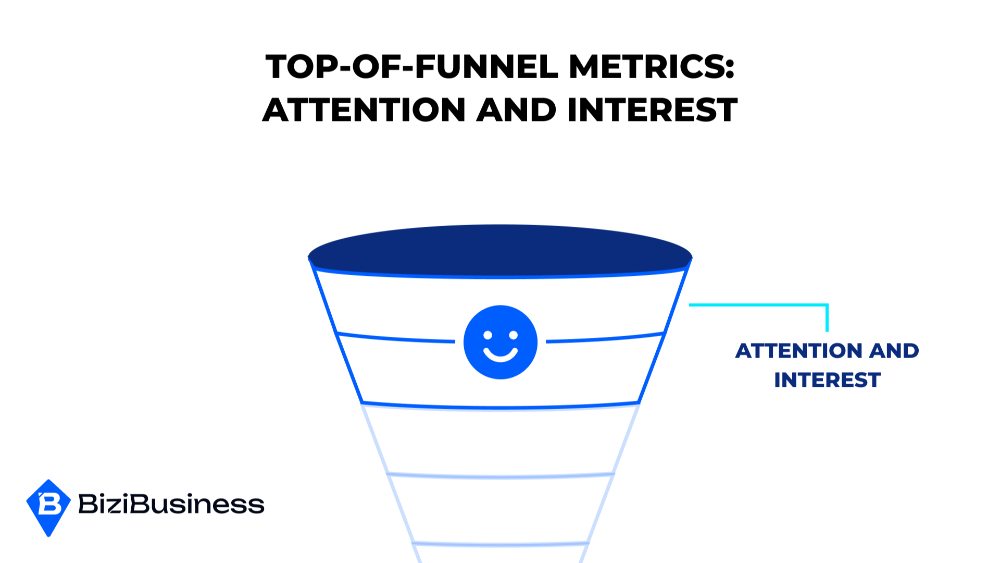
Top-of-funnel (TOFU) metrics reveal how well your emails capture attention and generate initial engagement. These numbers don’t always tell the full story—but they do highlight whether your subject lines, timing, and overall positioning are working to hook readers.
While these metrics are often considered “early indicators,” they still play a vital role in helping you diagnose problems and spot opportunities to optimize.
Open Rate (With Caveats)
What it measures: The percentage of delivered emails that were opened.
Why it matters: Open rate was once a primary success metric. Today, with Apple Mail Privacy Protection and other privacy updates, it’s much less reliable—especially for iOS users, where opens may be falsely triggered.
How to use it today:
- Use open rate trends (not raw numbers) to spot major drops or subject line effectiveness
- Supplement with more reliable metrics like click-through rate or click-to-open rate
- Be cautious about segmenting or triggering automations based solely on opens
Click-Through Rate (CTR)
What it measures: The percentage of recipients who clicked at least one link in your email.
Why it matters: This is a much clearer sign of actual engagement and interest. High CTR means your content and CTA are aligned with recipient intent.
What to track:
- Total CTR vs. unique CTR
- Device breakdown (mobile vs. desktop)
- Link-specific click heatmaps (where users clicked inside your layout)
Click-to-Open Rate (CTOR)
What it measures: The percentage of users who clicked after opening your email. (Clicks ÷ Opens)
Why it matters: CTOR shows how well your email content resonates after you win the open. It helps separate strong content from simply strong subject lines.
Good to know: CTOR helps isolate problems—if your open rate is high but CTOR is low, you may have misaligned copy, poor formatting, or weak calls to action.
Engagement Depth (Advanced ESPs)
Some platforms go beyond CTR with metrics like:
- Scroll depth (how far users read down your email)
- Heatmaps (where attention and clicks concentrate)
- Time on email (how long users engage before exiting)
Why it matters: This behavioral data helps refine layout, design hierarchy, and content structure—especially for long-form or editorial-style emails.
TOFU metrics are your early performance signals. They don’t prove ROI—but they do show whether your message is getting noticed and enticing action. If attention is weak here, it’s often a symptom of poor targeting, irrelevant content, or uninspired creative.
Middle-of-Funnel Metrics – Action and Conversion
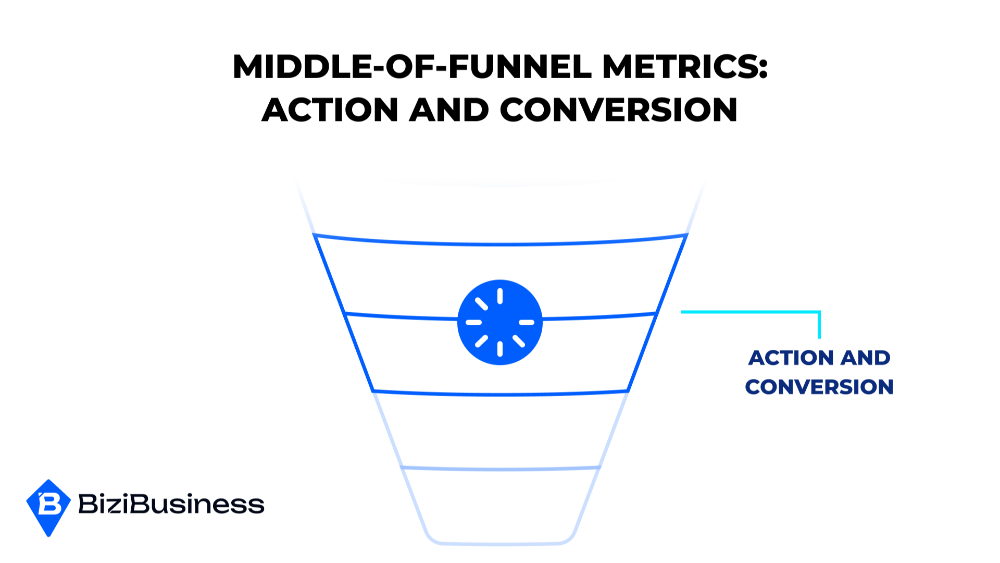
Middle-of-funnel (MOFU) metrics help you understand whether your email campaigns are driving meaningful actions—not just getting attention. These are the numbers that show how your messaging influences decisions like signing up, purchasing, or requesting a demo.
When TOFU metrics tell you what caught the eye, MOFU metrics reveal what moved the needle.
Conversion Rate
What it measures: The percentage of recipients who took a desired action (purchase, form fill, event signup) after clicking an email.
Why it matters: This is your most direct signal of campaign effectiveness. High opens and clicks are great, but if no one converts, you’ve got a disconnect between engagement and value delivery.
What to track:
- Campaign-level conversion rate
- Goal-specific (purchase vs. download vs. form submit)
- Landing page alignment (email CTA vs. post-click experience)
Click-to-Conversion Rate
What it measures: Percentage of users who clicked an email and went on to complete a goal.
Why it matters: This narrows the focus to post-click performance—ideal for identifying friction in landing pages, checkout flows, or offer relevance.
Tip: If this number is low, you likely need to revisit your offer clarity, button placement, or post-click UX.
Revenue per Email / Subscriber
What it measures: Average revenue earned from each email sent (or each contact on your list).
Why it matters: This metric translates engagement into real business value. It helps prioritize your most profitable campaigns, audiences, or automations.
Use it to:
- Compare campaign profitability
- Justify resource allocation to high-ROI segments
- Evaluate ESP pricing models based on actual return
Segmentation Performance
What it measures: How different subscriber groups respond to your emails—based on behavior, lifecycle stage, or attributes.
Why it matters: Blanket campaigns rarely perform as well as targeted ones. Understanding which segments convert at higher rates allows you to optimize future sends by tailoring messages.
Look at:
- CTR and conversion by lifecycle (new vs. returning)
- Engagement by purchase behavior or interest group
- Segment-specific revenue impact
MOFU metrics are where campaign impact gets real. They tell you whether your messaging, timing, and targeting are aligned with business objectives—not just inbox behavior. And they’re essential for turning email from a communication tool into a revenue engine.
Bottom-of-Funnel Metrics – Loyalty and Lifetime Value
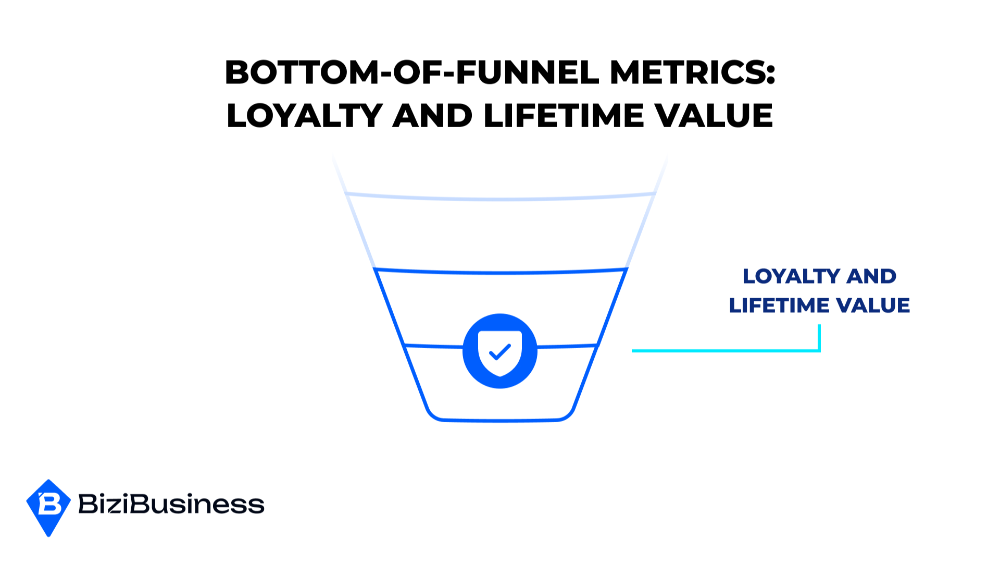
While top- and mid-funnel metrics focus on engagement and conversions, bottom-of-funnel (BOFU) metrics help you track long-term impact. These are the signals that reveal whether your emails build customer loyalty, increase retention, and boost overall customer value.
BOFU metrics are critical for brands that want sustainable growth—not just short-term wins.
Retention and Re-Engagement Rate
What it measures: The percentage of customers who continue to engage or return after their first interaction or purchase.
Why it matters: It’s cheaper to retain a customer than acquire a new one. High retention often reflects strong onboarding, value delivery, and ongoing communication—much of which is driven by email.
How to use it:
- Monitor repeat open and click behavior over time
- Track email responses to loyalty or reactivation campaigns
- Use re-engagement rate to evaluate win-back flows
Subscriber Lifetime Value (LTV)
What it measures: The total revenue generated by a subscriber over the entire duration of their relationship with your brand.
Why it matters: This is one of the most important long-term email metrics. It shifts focus from short-term campaign success to overall customer health and business value.
What to track:
- LTV by segment or automation (e.g., nurture flow vs. product launch)
- Compare LTV of email-driven vs. non-email-driven customers
- Use to inform acquisition budgets and frequency strategy
Email-Driven Repeat Purchases or Upsells
What it measures: The frequency and value of purchases that occur as a direct result of email follow-up, recommendations, or loyalty content.
Why it matters: This metric proves whether your post-purchase or retention strategies are actually driving incremental value—not just repeat noise.
Use it to:
- Refine product recommendation logic
- Optimize cross-channel integration timing and messaging
- Personalize loyalty and VIP flows based on past conversion behavior
Churn Rate and Unsubscribe Patterns
What it measures: The percentage of your list that unsubscribes or becomes inactive over a specific time period.
Why it matters: A rising churn rate can signal poor list health, irrelevant content, over-sending, or poor timing. It also reduces your deliverability and hurts sender reputation.
Look at:
- Unsubscribe spikes by campaign type
- Churn by list segment
- Trends in inactivity (no opens/clicks for 30, 60, or 90 days)
List Health Metrics – Deliverability And Decay
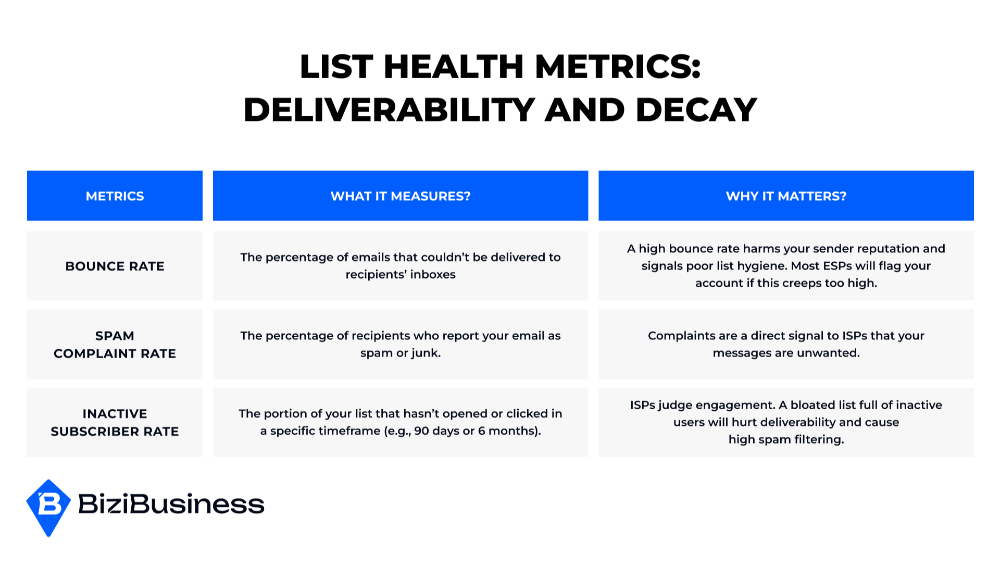
A high-performing email strategy isn’t just about crafting better messages—it’s also about protecting your list quality and reputation over time. List health metrics help you measure the unseen factors that affect everything from inbox placement to long-term campaign performance.
Think of your list building like a garden: if it’s overgrown with inactive, fake, or low-quality contacts, it won’t grow well—no matter how good your content is.
Bounce Rate
What it measures: The percentage of emails that couldn’t be delivered to recipients’ inboxes.
Types of bounces:
- Soft bounce: Temporary issue (e.g., full inbox, server delay)
- Hard bounce: Permanent failure (e.g., invalid or non-existent address)
Why it matters: A high bounce rate harms your sender reputation and signals poor list hygiene. Most ESPs will flag (or suspend) your account if this creeps too high.
Target: Bounce rate should be under 2%, ideally below 1%.
Spam Complaint Rate
What it measures: The percentage of recipients who report your email as spam or junk.
Why it matters: Complaints are a direct signal to ISPs that your messages are unwanted. Too many can get you blacklisted, or cause your messages to go straight to spam.
Target: Stay well under 0.1%. Anything above this is a warning sign.
Reduce complaints by:
- Letting subscribers manage preferences
- Setting clear expectations at opt-in
- Avoiding aggressive or misleading subject lines
Inactive Subscriber Rate
What it measures: The portion of your list that hasn’t opened or clicked in a specific timeframe (e.g., 90 days or 6 months).
Why it matters: ISPs judge engagement. A bloated list full of inactive users will hurt deliverability, lower open rates, and lead to higher spam filtering.
Best practices:
- Run re-engagement campaigns every 90–120 days
- Segment and suppress long-term inactive users
- Consider sunsetting disengaged subscribers
List Growth vs. List Decay
What it measures: The rate at which your email list gains new subscribers versus how many churn (unsubscribe, bounce, or become inactive).
Why it matters: A healthy list is one that grows steadily while maintaining quality. High churn or decay without enough new leads puts pressure on every campaign to perform.
Track:
- Net list growth monthly or quarterly
- Lead source quality (where subscribers come from)
- Long-term retention by acquisition channel
The takeaway: A great email strategy is built on a healthy list. If you ignore deliverability and decay, even your best campaigns won’t land—or convert. List health is your foundation. Keep it clean, keep it active, and keep it permission-based.
Attribution And ROI Analytics
Clicks and opens are useful—but they don’t always reflect how email contributes to your bottom line. To measure true performance, you need attribution: the ability to track how email fits into the bigger picture of your marketing funnel, customer journey, and revenue growth.
This is where email marketing moves from engagement metrics to business metrics—and where the smartest strategies are built.
Multi-Touch Attribution
What it measures: How much influence each marketing channel (including email) has on a conversion, across multiple touchpoints.
Why it matters: Very few conversions come from one interaction. If email nurtures a lead after a webinar and before a purchase, that value should be measured—even if the “last click” came from a paid ad.
Popular attribution models:
- First-touch: Email gets credit if it initiated the journey
- Last-touch: Credit goes to the final click before conversion
- Linear/multi-touch: Equal credit across multiple steps
- Time-decay: More recent touchpoints get more weight
Best practice: Choose a model that fits your customer journey length and sales complexity—and apply it consistently.
UTM Tracking and Goal Setup
What it is: UTM parameters are tags added to email links that help tools like Google Analytics track traffic source, campaign name, and medium.
Why it matters: Without UTM tracking, your email traffic shows up as “direct” or “unknown” in analytics. With UTMs, you can track site behavior, conversion paths, and revenue triggered by email.
Use UTMs to:
- Analyze on-site behavior of email visitors (bounce, time on site, conversion)
- Compare email campaign performance side-by-side with ads, SEO, etc.
- Create custom segments in GA4 for deeper reporting
Comparing ESP vs. GA vs. CRM Reporting
Different platforms tell different stories—and each has strengths and gaps:
- ESP reporting (e.g., Klaviyo, Mailchimp): Great for opens, clicks, and email-level performance
- Google Analytics (GA4): Best for understanding what happens after the click—sessions, conversions, site paths
- CRM systems (e.g., HubSpot, Salesforce): Ideal for tracking customer-level impact over time—pipeline influence, deal stage progression, LTV
Pro tip: Use cross-platform reporting to triangulate the full journey. No single tool gives the whole picture.
Revenue Attribution and ROI Calculations
What to measure:
- Revenue per campaign or automation
- Revenue per email sent (RPE)
- Customer acquisition cost (CAC) for email-only leads
- Lifetime value (LTV) of email-acquired customers
Why it matters: These are the KPIs that CFOs care about—and the data that helps you defend budget, prioritize efforts, and forecast results.
How to use it:
- Identify top-performing flows and replicate winning patterns
- Justify investments in segmentation, automation, or personalization
- Adjust acquisition strategies based on channel payback period
Testing And Optimization Metrics
No email strategy is perfect on the first try. The best marketers treat every send as a test—and every metric as feedback. A/B testing allows you to refine subject lines, offers, timing, and creative decisions with real data, not gut instinct.
But testing only works when you measure the right things, interpret the results correctly, and apply what you learn at scale.
Set Clear Hypotheses Before You Test
What to avoid: Testing just to test—“let’s try two subject lines and see what happens”—rarely leads to useful insight.
What to do instead: Formulate a clear hypothesis like:
- “Personalized subject lines will improve open rate by 15%”
- “Shorter emails will result in higher click-to-convert rates”
- “Moving the CTA above the fold will increase CTR”
Testing is most valuable when you isolate one variable at a time and tie it to a measurable outcome.
Key Metrics to Use in Testing
- Open Rate – Best for subject line and sender name tests
- Click-Through Rate (CTR) – Ideal for testing CTA placement, design, or copy
- Click-to-Open Rate (CTOR) – Helps identify how compelling your email body is after opening
- Conversion Rate – Essential for measuring landing page alignment or offer effectiveness
- Revenue per Email – Ultimate performance metric for high-intent or sales-driven sends
Choose the metric that aligns most directly with the outcome you’re trying to influence.
Measuring Test Significance
A winning variant doesn’t mean much if it’s based on a small sample or random fluctuation. You need statistical confidence.
Basic tips:
- Use your ESP’s built-in test significance calculator if available
- Ensure each variation has enough volume (at least 1,000+ sends per variant is a solid baseline)
- Don’t call a test too early—let behavior stabilize over at least 24–48 hours
For more advanced users, tools and platforms like Google Optimize (deprecated), VWO, or external A/B test calculators can help validate significance thresholds.
Apply Learnings at Scale
Testing should influence more than just one campaign. Use what you learn to:
- Update your content or design templates
- Adjust automations based on highest-converting email types
- Refine your brand’s tone, length, or formatting across flows
- Develop “winning formulas” for subject lines or offers by audience type
Pro tip: Document all tests in a shared testing log or dashboard so your team doesn’t keep reinventing the wheel.
Bonus: When Not to Test
- Low-volume sends (under 500–1,000 recipients) rarely yield reliable results
- Testing multiple variables at once muddies insights
- If you’re mid-promotion or time-sensitive, avoid split-testing—pick your strongest bet based on past performance
Testing isn’t about getting one-off wins—it’s about building a feedback loop that compounds over time. When you measure wisely, act on results, and scale what works, optimization becomes part of your growth engine.
Know the Numbers That Grow Your Business
Email marketing isn’t just about writing compelling copy or designing eye-catching templates—it’s about understanding what actually works. And that means mastering your metrics.
Too often, teams chase surface stats like open rates or total send volume, thinking they reflect success. But in reality, the most impactful marketers are those who track, test, and optimize around metrics that tie directly to business outcomes: conversions, revenue, retention, and customer lifetime value.
Every email design you send is an opportunity—not just to engage, but to learn. When you shift your mindset from reporting to insight, your analytics become more than a spreadsheet—they become your roadmap to smarter decisions and sustainable growth.
Here’s the big takeaway:
Track what matters. Test what’s unclear. And always measure against what moves the business forward—not just what fills the dashboard.
Because in the end, email marketing isn’t won by volume. It’s won by vision, data, and a commitment to continuous improvement.
Subscribe to Newsletter
Unlock your creativity and stay up to date on marketing tips
