BiziTopics
Metrics That Matter: How to Optimize Your Paid Ads with Data
BiziBusiness
Jul 8, 2025
24 min read
Running paid ad campaigns without tracking the right metrics is like driving blindfolded.
You might be spending money and putting in the effort, but if you don’t know what’s working (and what isn’t), you’re just hoping for results.
The problem? Many businesses focus on vanity metrics—like impressions or clicks—without understanding how they actually impact ROI and conversions.
To truly make the most of your paid ad budget, you need to focus on metrics that matter.
In this guide, you’ll learn:
- Why data matters in paid advertising
- The most important metrics to track based on your campaign goals
- How to interpret data correctly and avoid common pitfalls
- Real-world examples of brands that optimized their campaigns using data
By the end, you’ll know exactly how to use data to fine-tune your paid ads, maximize your ROI, and make data-driven decisions that lead to consistent growth.
Avoiding Guesswork: Make Informed Decisions
Many businesses launch paid ad campaigns based on assumptions or gut feelings.
Without data, you might choose the wrong audience, focus on irrelevant metrics, or fail to spot underperforming ads.
Why Data Helps:
- Identifies which ad copy, visuals, or targeting settings actually resonate with your audience.
- Reduces the risk of wasting money on ineffective strategies.
- Enables A/B testing to find the best-performing version of your ads.
Understanding What Works (and What Doesn’t)
Data allows you to see the whole picture of your ad performance.
Without tracking metrics, you might think your campaign is successful just because it’s getting a lot of clicks.
But clicks alone don’t guarantee conversions.
How Data Helps:
- Breaks down performance into specific metrics (e.g., CTR, conversion rate, ROAS).
- Highlights underperforming ad groups so you can adjust or pause them.
- Shows which demographics or locations respond best to your ads.
Saving Money and Boosting ROI
Paid advertising can become a money pit if you’re not careful.
Data helps you spend smarter by pinpointing which campaigns deliver the best value.
Why It Matters:
- Identifies cost-per-click (CPC) and cost-per-conversion (CPC) variations across different campaigns.
- Helps you reallocate budget to high-performing ads.
- Reduces ad spend waste by discontinuing campaigns that don’t yield results.
Continuously Improving Your Strategy
One of the biggest benefits of data-driven advertising is the ability to continuously optimize.
Campaigns shouldn’t be static—they need regular adjustments to stay effective.
How Data Facilitates Improvement:
- Enables ongoing performance tracking rather than a one-time evaluation.
- Helps you test new ideas without risking your entire budget.
- Identifies seasonal trends or changing audience preferences.
Gaining a Competitive Edge
Brands that don’t track metrics are essentially flying blind.
Competitors who use data to their advantage will outperform you—both in efficiency and impact.
What Data Brings to the Table:
- Reveals industry benchmarks so you can see how your performance compares.
- Shows where your competitors are gaining traction (e.g., targeting specific keywords or demographics).
- Allows you to adapt faster to changing trends or ad platform updates.
The Foundation: Setting Clear Goals for Your Paid Ad Campaigns
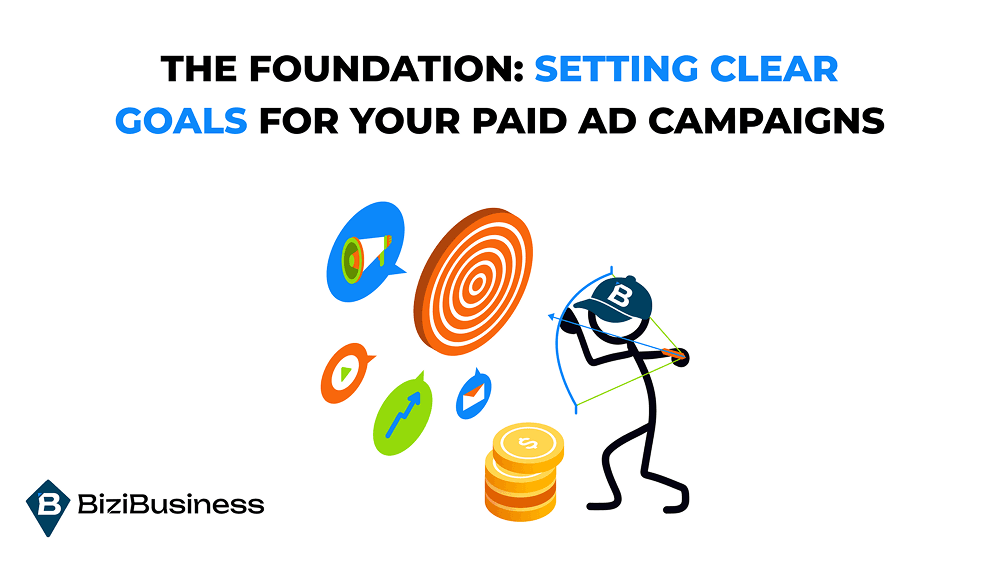
Before you even think about analyzing data, you need to know what success looks like for your paid ad campaigns.
Too often, businesses jump into advertising without setting clear, measurable goals, leading to confusion when evaluating results.
Why Goal Setting Is Crucial Before Tracking Metrics
You can’t optimize what you don’t define.
Setting goals gives your campaign a clear direction and ensures that every metric you track serves a specific purpose.
Benefits of Goal Setting:
- Focus: Helps you zero in on metrics that directly impact your objective.
- Clarity: Prevents you from getting lost in data overload.
- Measurement: Allows you to assess whether your campaign is successful or needs adjustments.
- Strategic Decisions: Guides budget allocation and creative choices.
Setting SMART Goals: Make Them Measurable
SMART goals are:
- Specific: Clearly define what you want to achieve.
- Measurable: Quantify your goal to track progress.
- Achievable: Set realistic expectations based on your budget and resources.
- Relevant: Align with your broader marketing strategy.
- Time-bound: Establish a deadline to evaluate success.
SMART Goal Example:
- Objective: Increase lead generation.
- SMART Goal: Generate 50 qualified leads from Facebook Ads within 30 days, with a CPL under $20.
Examples of Campaign Goals and Their Key Metrics
Brand Awareness:
Focus: Maximizing visibility and recognition
- Goal: Reach 100,000 unique users in 30 days
- Metrics:
- Impressions: How often your ad is shown
- Reach: Number of unique users who saw your ad
- Ad Recall Lift: Percentage of users who remember your ad
- Engagement Rate: Likes, shares, and comments
Engagement:
Focus: Encouraging interaction with your content
- Goal: Achieve a 5% engagement rate on social media ads
- Metrics:
- Click-Through Rate (CTR): Ratio of clicks to impressions
- Social Engagement: Likes, shares, and comments
- Video Views: How many people watched your video ad
- Time Spent: Duration of interaction with your content
Lead Generation:
Focus: Collecting potential customer information
- Goal: Acquire 200 new leads through Google Ads in 45 days
- Metrics:
- Cost Per Lead (CPL): How much you spend to acquire each lead
- Conversion Rate: Percentage of clicks that turn into leads
- Form Submission Rate: Number of completed forms vs. views
- Lead Quality Score: How well the leads match your target criteria
Sales and Conversions:
Focus: Driving purchases or sign-ups
- Goal: Generate $10,000 in sales from Instagram ads in 60 days
- Metrics:
- Cost Per Conversion (CPC): Expense to achieve a purchase
- Return on Ad Spend (ROAS): Revenue earned per dollar spent
- Conversion Rate: How many clicks lead to a sale
- Customer Acquisition Cost (CAC): Total cost to acquire a customer
Aligning Metrics with Campaign Objectives
Tracking the wrong metrics can make your campaign appear more successful or less effective than it actually is.
Make sure your chosen metrics directly support your goal.
Tips for Alignment:
- Don’t track CTR if your goal is brand awareness—focus on reach and impressions instead.
- If your objective is sales, don’t get distracted by likes or comments—prioritize CPC and ROAS.
- Regularly review your goals and metrics to ensure they stay relevant as your campaign evolves.
Revisiting and Adjusting Goals
Sometimes your initial goal might not align with actual performance.
Be prepared to adapt your objectives based on data insights.
Setting clear, measurable goals is the foundation of a successful paid ad strategy.
Key Metrics to Track for Different Campaign Goals
Not all campaigns are created equal.
The metrics that matter for a brand awareness campaign are vastly different from those that matter for lead generation or sales.
Focusing on irrelevant metrics can lead to misleading conclusions and wasted ad spend.
Tracking the right data points ensures that your analysis is accurate and actionable.
To get the most out of your data, it’s essential to align your metrics with your campaign goals.
Awareness Campaigns: Building Brand Visibility
Objective: Maximize reach and make your brand memorable.
Key Metrics:
- Impressions: The number of times your ad is displayed.
- Reach: The number of unique users who saw your ad.
- Brand Lift: Measures changes in brand perception.
- Ad Recall Lift: Gauges how well users remember your ad.
- Frequency: How often the same user sees your ad.
- Cost Per Thousand Impressions (CPM): Cost to reach 1,000 people.
Why These Metrics Matter:
- High impressions indicate your ad is visible, but if reach is low, you may be targeting too narrow an audience.
- Brand lift shows whether your ad positively affects brand perception.
- Tracking frequency helps you avoid ad fatigue—showing the same ad too often.
- CPM helps you understand the cost-efficiency of your awareness campaign.
Engagement Campaigns: Encouraging Interaction
Objective: Increase user interaction and content engagement.
Key Metrics:
- Click-Through Rate (CTR): The percentage of people who clicked your ad after seeing it.
- Engagement Rate: Includes likes, comments, shares, and other interactions.
- Video Views: Number of users who watched your video ad.
- Watch Time: How long viewers stayed engaged with your video.
- Social Shares: How often users shared your content.
Why These Metrics Matter:
- A high CTR indicates that your ad is relevant and appealing.
- The engagement rate shows how actively users are interacting with your content.
- If video views are high but watch time is low, it may indicate that your intro isn’t captivating enough.
- Social shares amplify your reach organically, indicating strong content resonance.
Lead Generation Campaigns: Capturing Potential Customers
Objective: Collect information from interested prospects.
Key Metrics:
- Cost Per Lead (CPL): The average cost to acquire a lead.
- Conversion Rate: The percentage of clicks that result in a completed lead form.
- Form Submission Rate: The percentage of users who complete the form after clicking.
- Lead Quality Score: How well the acquired leads match your ideal customer profile.
- Bounce Rate: How many users leave the landing page without taking action.
Why These Metrics Matter:
- CPL helps you understand the cost-effectiveness of your lead generation.
- A high conversion rate means your landing page is effective.
- Low form submission rates may indicate that the form is too long or complicated.
- Lead quality ensures you’re not just collecting names but actually generating valuable prospects.
- A high bounce rate might suggest that your ad misleads users or that the landing page needs improvement.
Sales and Conversions Campaigns: Driving Purchases
Objective: Turn clicks into actual revenue.
Key Metrics:
- Cost Per Conversion (CPC): Expense to drive a single sale.
- Conversion Rate: The percentage of clicks that result in a purchase.
- Return on Ad Spend (ROAS): Revenue generated for every dollar spent.
- Customer Acquisition Cost (CAC): The total cost to acquire a paying customer.
- Average Order Value (AOV): How much each customer spends per transaction.
- Cart Abandonment Rate: The percentage of users who leave items in their cart without completing the purchase.
Why These Metrics Matter:
- High ROAS means your ads are generating significant revenue compared to their cost.
- A low conversion rate suggests a disconnect between your ad and landing page.
- Tracking CAC helps ensure your acquisition cost doesn’t exceed customer lifetime value (CLV).
- If cart abandonment is high, consider optimizing the checkout process or offering reminders.
When your metrics align with your goals, you can make data-driven decisions that truly enhance your ad performance.
Don’t just track everything—track what matters most for your specific campaign.
Advanced Metrics for Deeper Insights
Advanced metrics reveal insights that basic metrics can’t capture, allowing you to make strategic adjustments rather than just surface-level tweaks.
Tracking fundamental metrics like CTR, conversion rate, and ROAS is essential, but advanced metrics offer a more nuanced view of your campaign’s effectiveness.
Understanding these metrics ensures your campaign doesn’t just perform well on paper but actually drives meaningful results.
By analyzing deeper data points, you can uncover hidden trends, understand customer behavior, and make more informed optimizations.
Let’s explore the advanced metrics you should be tracking and how they can enhance your paid ad strategy.
Attribution Models: Understanding the Customer Journey
Attribution models show you how different touchpoints contribute to a conversion.
Instead of crediting the last click only, these models give a more holistic view of your campaign’s impact.
Common Attribution Models:
- Last-Click Attribution: Credits the last interaction before conversion.
- First-Click Attribution: Credits the first interaction that initiated the journey.
- Linear Attribution: Distributes equal credit across all touchpoints.
- Time Decay Attribution: Gives more credit to recent interactions.
- Position-Based Attribution: 40% to the first and last interactions, 20% to the middle.
- Data-Driven Attribution: Uses algorithms to assign credit based on actual data.
Example:
Your customer first sees a social media ad, then clicks a Google search ad, and finally makes a purchase through a remarketing ad.
A position-based attribution model would credit both the first and last touchpoints significantly, highlighting the importance of both awareness and retargeting.
Lifetime Value (LTV): Measuring Long-Term Profitability
LTV estimates the total revenue you can expect from a customer over the duration of their relationship with your brand.
It’s crucial for understanding whether your customer acquisition cost (CAC) is justified.
How to Calculate LTV:
- LTV = (Average Order Value) × (Purchase Frequency) × (Customer Lifespan)
- For subscription models:
- LTV = (Average Revenue Per User) × (Subscription Duration)
Example:
If a customer spends $50 per month for an average of 2 years, the LTV is $1,200.
If your CAC is $100, you’re seeing a healthy return.
Frequency and Ad Fatigue: Keeping Your Audience Engaged
Frequency measures how often the same person sees your ad.
High frequency can lead to ad fatigue, where users become annoyed or indifferent to your message.
How to Measure Frequency:
- Frequency = Impressions / Unique Users
- Platforms like Facebook Ads Manager and Google Ads track this automatically.
Example:
Your ad has a frequency of 7, meaning the average user has seen it 7 times.
If CTR drops significantly after the third view, it’s time to update the creative.
View-Through Conversions: Measuring Indirect Impact
These conversions occur when users see your ad but don’t click, only to convert later through a different channel.
It helps you understand the indirect influence of your ads.
How to Measure:
- Tracked by platforms like Google Ads and Facebook Ads.
- Typically measured within a 24- to 30-day attribution window.
Example:
A YouTube ad doesn’t result in direct clicks but correlates with a 10% increase in organic traffic to your website over the following week.
Cost Per Thousand Impressions (CPM): Measuring Reach Efficiency
CPM tells you how much you’re paying to get 1,000 impressions.
It’s an essential metric for brand awareness campaigns where reach is the priority.
How to Calculate:
- CPM = (Total Ad Spend / Impressions) × 1,000
Example:
You spend $500 on an awareness campaign and get 100,000 impressions.
Your CPM is $5, indicating a reasonable cost to reach a large audience.
Cross-Device Conversions: Tracking Multi-Platform Journeys
Cross-device conversions occur when a user interacts with your ad on one device but converts on another.
This metric helps you understand the multi-device journey of your audience.
How to Track:
- Platforms like Google Ads use user profiles and cookies to track these conversions.
- Set up cross-device tracking in your campaign settings.
Example:
A user clicks your Instagram ad on their phone but completes the purchase on their laptop.
Cross-device tracking shows that your mobile ad played a critical role.
By looking beyond basic metrics, you can make more strategic decisions that enhance your paid ad performance.
Leverage these insights to not just optimize your campaigns but to maximize long-term results.
Analyzing Your Data: Making Sense of the Numbers
Data without context is just noise—learn how to find the story behind the numbers.
Collecting data is just the first step.
To truly improve your paid ad campaigns, you need to interpret that data accurately and act on it strategically.
Analyzing your data correctly helps you spot patterns, opportunities, and areas for improvement.
Misinterpretation can lead to costly decisions and ineffective ad strategies.
It’s not enough to know your CTR or ROAS—you need to understand why those numbers look the way they do.
Let’s break down how to make sense of your paid ad data and use it to drive better results.
Identify Trends and Patterns: Look Beyond One Metric
Data points are more insightful when viewed in context rather than isolation.
Tracking long-term trends helps you understand seasonal patterns, audience shifts, and campaign longevity.
How to Spot Trends:
- Use rolling averages to smooth out short-term fluctuations.
- Compare data from different time periods (week over week, month over month).
- Look for correlations between metrics (e.g., high impressions but low CTR).
- Use visualizations like line graphs or heat maps to spot patterns.
Example:
Your CTR dips every weekend. By analyzing data, you discover that your target audience is less active during that time.
Adjusting your ad schedule to weekday-heavy can boost performance.
Compare Performance Across Platforms: What Works Where?
Different platforms can yield very different results, even for the same ad content.
By comparing data across platforms, you can allocate your budget more efficiently.
How to Compare:
- Standardize your metrics: Calculate ROAS, CTR, and CPL consistently across all platforms.
- Create a performance dashboard that consolidates data from Google Ads, Facebook Ads, LinkedIn, etc.
- Track cross-platform attribution to understand how different channels interact.
- Analyze audience behavior differences between platforms.
Example:
Your Facebook ads generate lots of clicks but few conversions, while Google Ads deliver fewer clicks but higher conversion rates.
You decide to focus more budget on Google Ads for sales while using Facebook for brand awareness.
Benchmark Your Data: Know What Success Looks Like
Without a point of reference, your metrics lack context.
Benchmarks help you see whether your results are good, average, or poor compared to industry standards.
Where to Find Benchmarks:
- Industry reports from sources like HubSpot, WordStream, or SEMrush
- Platform-specific benchmarks (e.g., Facebook Ad Manager’s industry averages)
- Historical data from your own past campaigns
Example:
Your Google Ads CTR is 2.5%, but the industry benchmark for your niche is 4%.
Investigate your ad copy and targeting to find areas for improvement.
Use A/B Testing: Isolate the Variables
A/B testing allows you to compare two versions of an ad to see which performs better.
Testing helps you make data-driven decisions rather than relying on assumptions.
What to Test:
- Ad Copy: Different headlines or CTAs
- Visual Elements: Images vs. videos
- Audience Segments: Different demographic groups
- Ad Formats: Carousel ads vs. single image ads
- Bid Strategies: Manual CPC vs. automated bidding
How to Analyze Results:
- Use statistical significance calculators to confirm whether the difference is meaningful.
- Run tests long enough to gather reliable data—don’t draw conclusions too early.
- Implement changes gradually to avoid disrupting your entire campaign.
Example:
Version A uses a discount-focused CTA, while Version B highlights product quality.
After two weeks, Version A has a 20% higher conversion rate, indicating that price sensitivity is a major factor for your audience.
Segment Your Data: Get Specific for Better Insights
Segmenting your data allows you to see performance differences among various audience groups.
Breaking down metrics by age, location, device, or behavior helps you refine your targeting.
Segmentation Strategies:
- Demographic Segmentation: Gender, age, income level
- Behavioral Segmentation: New visitors vs. returning customers
- Geographical Segmentation: Performance by location
- Device Segmentation: Desktop vs. mobile performance
Why It Matters:
- You might discover that mobile users have a lower conversion rate, prompting you to optimize your landing page for smartphones.
- Segmenting by age group may reveal that younger users respond better to video ads, while older users prefer static images.
Example:
Your data shows that 18-24-year-olds respond better to short, humorous ads, while 35+ audiences prefer informative content.
Adjusting your creative based on these insights improves overall performance.
Calculate ROI: Are Your Efforts Paying Off?
ROI is the ultimate measure of whether your campaign is financially viable.
It helps you understand whether your ad spend is generating enough revenue to justify the investment.
How to Calculate ROI:
- ROI = (Net Profit / Cost of Investment) × 100
- Use attribution models to ensure accurate calculation when multiple channels are involved.
Why It Matters:
- ROI directly impacts your ad budget decisions.
- Low ROI might indicate that your CPC is too high or your conversion rate is too low.
- Helps you make data-driven decisions on whether to scale, pause, or adjust your campaigns.
Example:
Your Instagram ad campaign generated $8,000 in revenue with a $2,000 ad spend.
Your ROI is 300%, indicating a successful campaign.
By analyzing your data correctly, you can transform insights into actionable strategies, optimizing your campaigns for consistent success.
Don’t just track data—interpret it, learn from it, and act on it.
Common Pitfalls to Avoid When Interpreting Metrics
Avoiding the traps that lead to misleading conclusions and wasted ad spend.
Interpreting paid ad metrics isn’t just about looking at the numbers—it’s about understanding what they mean in context.
Even experienced marketers can fall into data interpretation traps that skew their insights and lead to poor decision-making.
Why does this matter?
Making decisions based on misinterpreted data can lead to budget waste, ineffective optimizations, and missed opportunities.
Learning to identify and avoid these common pitfalls will help you make data-driven choices that truly enhance your ad performance.
Here are the most common mistakes to watch out for—and how to avoid them.
Focusing on Vanity Metrics: Numbers That Don’t Drive Results
Vanity metrics are data points that look impressive on the surface but don’t directly correlate with your campaign goals.
Metrics like impressions, likes, and clicks can be misleading if you don’t connect them to actual outcomes.
Why It’s a Problem:
- High impressions don’t mean high engagement.
- Lots of likes don’t necessarily translate to conversions or sales.
- Clicks without follow-through can indicate poor landing page alignment.
How to Avoid:
- Tie your metrics to specific goals (e.g., clicks are useful for traffic, but not for sales).
- Prioritize actionable metrics like CPC, conversion rate, and ROAS.
- Regularly review whether your metrics align with your campaign objectives.
Confusing Correlation with Causation: Not Everything That Moves Together Is Related
Just because two metrics change at the same time doesn’t mean one caused the other.
Assuming causation when there’s only correlation can lead to faulty optimizations.
Why It’s a Problem:
- You might attribute success to the wrong factor.
- You could make unnecessary changes that harm performance.
- You risk misallocating budget based on false assumptions.
How to Avoid:
- Always ask, “Is there a logical connection between these metrics?”
- Test your hypothesis with A/B testing or controlled experiments.
- Use attribution models to understand the real path to conversion.
Ignoring Context: Metrics Without Background Are Meaningless
Metrics can look promising or concerning without considering the bigger picture.
Looking at ROAS in isolation, for example, might not reveal seasonal trends or external influences like promotions.
Why It’s a Problem:
- Leads to misinterpretation of what’s really happening.
- Can result in drastic changes when a small adjustment would suffice.
- Overlooks external factors that impact campaign performance.
How to Avoid:
- Compare your current data to historical performance.
- Factor in external variables (e.g., holidays, market changes, news events).
- Regularly benchmark your performance against industry standards.
Overreacting to Short-Term Fluctuations: The Danger of Knee-Jerk Reactions
Metrics naturally fluctuate due to factors like ad fatigue, algorithm changes, or external events.
Overreacting to minor dips can lead to hasty optimizations that actually hurt your long-term strategy.
Why It’s a Problem:
- Disrupts campaigns that are actually performing well overall.
- Can result in frequent, unnecessary changes.
- Ignores the fact that trends are more important than isolated data points.
How to Avoid:
- Focus on longer-term trends rather than day-to-day changes.
- Set performance thresholds that trigger reviews rather than immediate changes.
- Compare weekly or monthly data instead of reacting to daily reports.
Misinterpreting A/B Test Results: Jumping to Conclusions
A/B testing is a great way to optimize, but drawing conclusions too early can be misleading.
If you end your test before collecting enough data, your results may be statistically insignificant.
Why It’s a Problem:
- Leads to false positives or negatives.
- Wastes resources on changes that don’t actually improve performance.
- Can give the illusion of success when the difference is just random variance.
How to Avoid:
- Use an A/B testing calculator to determine the sample size needed.
- Set a minimum duration for tests (e.g., two weeks) to gather sufficient data.
- Analyze the confidence level before declaring a winner.
Failing to Account for Ad Fatigue: When Good Ads Go Stale
Ads that perform well at first can lose effectiveness as audiences grow tired of seeing them.
Assuming that an ad will continue performing well without refreshing it is a common mistake.
Why It’s a Problem:
- Results in declining CTR and conversion rates.
- Wastes ad spend on campaigns that no longer resonate.
- Misses opportunities to re-engage users with fresh content.
How to Avoid:
- Monitor frequency metrics to see how often users are seeing your ad.
- Plan to rotate ad creatives every few weeks.
- Use dynamic ad variations to keep the content fresh.
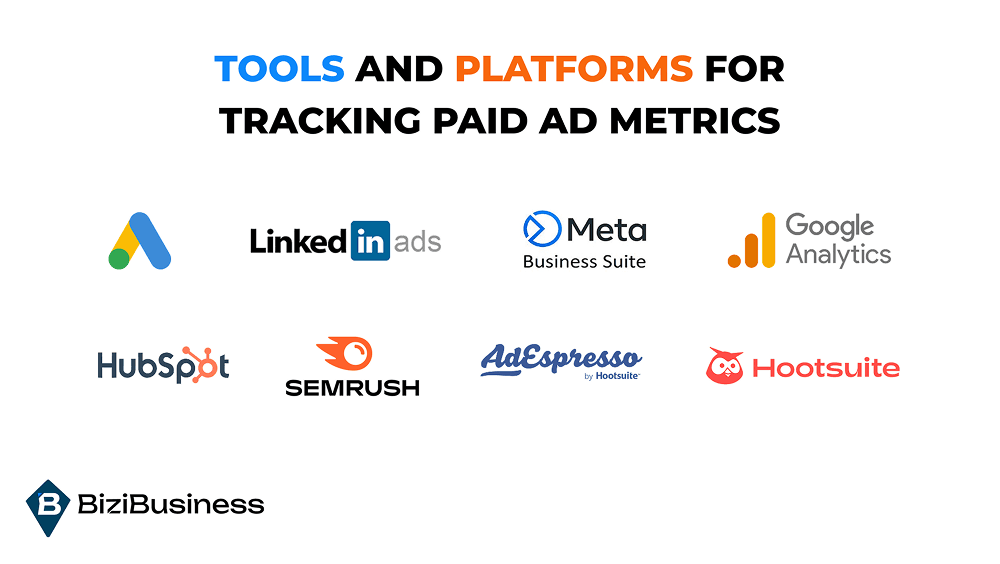
Tools and Platforms for Tracking Paid Ad Metrics
Managing paid ad campaigns across multiple platforms can be overwhelming.
To make sense of your data and optimize performance, you need robust tools that track, analyze, and visualize your metrics in one place.
The right tools help you save time, reduce errors, and gain actionable insights.
Instead of manually gathering data from different sources, you can focus on analyzing trends and making strategic decisions.
Google Ads: Comprehensive Data for Search and Display Campaigns
Google Ads is the go-to platform for search, display, and video advertising.
It offers in-depth metrics to track impressions, clicks, conversions, and more.
Best For:
- Businesses focused on search intent and targeted display ads.
- Analyzing the ROI of keyword-based campaigns.
- Gaining insights into cross-channel performance through Google Analytics integration.
Facebook Ads Manager: Social Engagement and Conversion Tracking
Facebook Ads Manager is essential for running campaigns on Facebook and Instagram.
It provides metrics to measure reach, engagement, leads, and sales.
Best For:
- Brands looking to build community engagement and brand awareness.
- Tracking social interactions like comments, shares, and clicks.
- Retargeting users who have visited your website or interacted with your content.
LinkedIn Campaign Manager: B2B Advertising Insights
LinkedIn Campaign Manager is ideal for B2B marketing, targeting professionals and decision-makers.
It tracks metrics like leads, website visits, and social engagement.
Best For:
- Businesses targeting professionals, recruiters, and industry leaders.
- Tracking lead quality and engagement among B2B audiences.
- Analyzing content performance within a professional network.
Google Analytics: In-Depth Traffic and Conversion Analysis
Google Analytics integrates with your paid ad platforms to provide comprehensive insights into user behavior.
It tracks data from Google Ads, social media campaigns, and organic traffic.
Best For:
- Combining data from multiple ad platforms for a holistic view.
- Tracking post-click engagement and website behavior.
- Analyzing the full customer journey from discovery to conversion.
HubSpot: CRM and Marketing Metrics in One Place
HubSpot integrates ad tracking with your CRM, providing a complete view of customer interactions.
It tracks metrics related to lead generation, conversion rates, and sales performance.
Best For:
- Businesses that need to align ad performance with sales data.
- Creating automated workflows that follow up on ad-driven leads.
- Tracking customer journeys from ad engagement to closed deals.
Third-Party Analytics Platforms: Multi-Channel Reporting
Tools like SEMrush, Hootsuite, and AdEspresso help consolidate data from multiple ad platforms.
They offer advanced analytics for campaign performance, competitor analysis, and optimization insights.
Best For:
- Managing multi-platform ad campaigns efficiently.
- Tracking competitor ad performance and comparing strategies.
- Accessing more advanced metrics that may not be available on native platforms.
Choosing the right tools is crucial for making data-driven decisions that optimize your ad performance.
Integrate these platforms to create a centralized analytics hub and stay on top of your paid ad metrics.
Closing: Turn Data Into Action
Tracking metrics is crucial, but the real value lies in turning insights into actionable strategies.
To truly optimize your paid ads, you need to analyze data correctly, avoid common pitfalls, and use the right tools to streamline your process.
Key Takeaways:
- Start with Clear Goals: Align your metrics with specific campaign objectives.
- Track What Matters: Focus on metrics that directly impact your ROI and success.
- Analyze Thoughtfully: Avoid common mistakes like relying on vanity metrics or ignoring context.
- Leverage the Right Tools: Use platforms like Google Ads, Facebook Ads Manager, LinkedIn Campaign Manager, and Google Analytics to centralize your data.
- Continuously Optimize: Use data to guide improvements, A/B test regularly, and adapt your strategy as trends change.
By staying focused on relevant metrics, avoiding data interpretation mistakes, and using robust tools, you can make your paid ad strategy more effective and profitable.
The goal is not just to track data but to turn insights into action—boosting engagement, generating leads, and driving revenue.
Start optimizing your paid ad campaigns today by using data as your guide—not just your backup.
The more you understand your metrics, the more successful your advertising will be.
Subscribe to Newsletter
Unlock your creativity and stay up to date on marketing tips
