BiziTopics
The Ultimate Guide to Marketing Analytics and Metrics That Drive ROI
BiziBusiness
Aug 12, 2025
15 min read
Marketers today have access to more data than ever but that hasn’t made decision-making easier. In fact, it’s made it harder. With dozens of platforms generating hundreds of data points, many teams fall into the trap of tracking everything and acting on nothing.
Too often, marketing metrics are chosen based on availability, not impact. We measure likes, page views, and followers because they’re easy to see but they don’t always tell us what’s working. And when metrics don’t tie back to outcomes, they create a false sense of progress.
To grow smarter, you need to get ruthless about what you track. ROI-driven metrics cut through the noise. They tell you what’s performing, what’s wasting budget, and where to optimize. They shift the conversation from “how many” to “how valuable.”
If you’re not aligning your marketing analytics with revenue and retention, you’re not really measuring success. This guide is here to help you fix that—by focusing only on the numbers that move the business forward.
Foundations: The Difference Between Metrics, KPIs, and Analytics
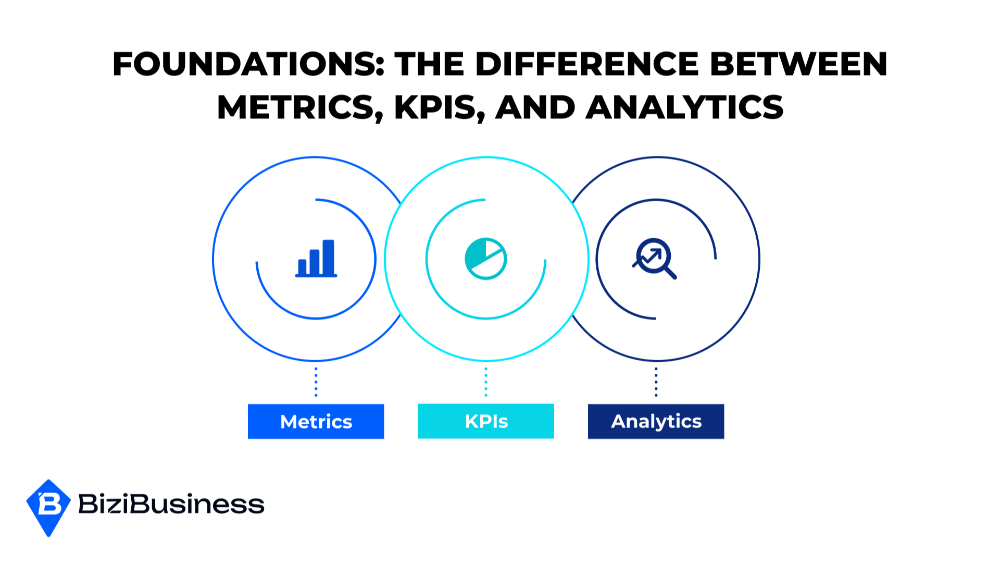
Before you can use data to drive ROI, you need to understand what you’re looking at. Marketers often use terms like “metrics,” “KPIs,” and “analytics” interchangeably—but they’re not the same. And confusing them leads to wasted time, scattered focus, and weak reporting.
Metrics are raw numbers. Think: page views, open rates, click-throughs, bounce rates. This is what happened. They give you the basic facts but offer no context.
KPIs—key performance indicators—go a step further. These are the metrics that matter most for your business objectives. A metric becomes a KPI when it’s tied directly to a specific goal, such as lead generation, customer acquisition cost, or conversion rate. KPIs turn raw data into a benchmark for performance.
Analytics, meanwhile, is about interpretation. It’s the process of analyzing metrics and KPIs to understand patterns, spot opportunities, and make decisions. Analytics is the engine behind strategy—it connects data to action.
Here’s the bottom line:
- Metrics tell you what’s happening
- KPIs tell you what matters
- Analytics tells you what to do about it
When you define each clearly, you stop chasing numbers for the sake of it—and start building a system that informs real business growth.
Core Categories of Marketing Metrics
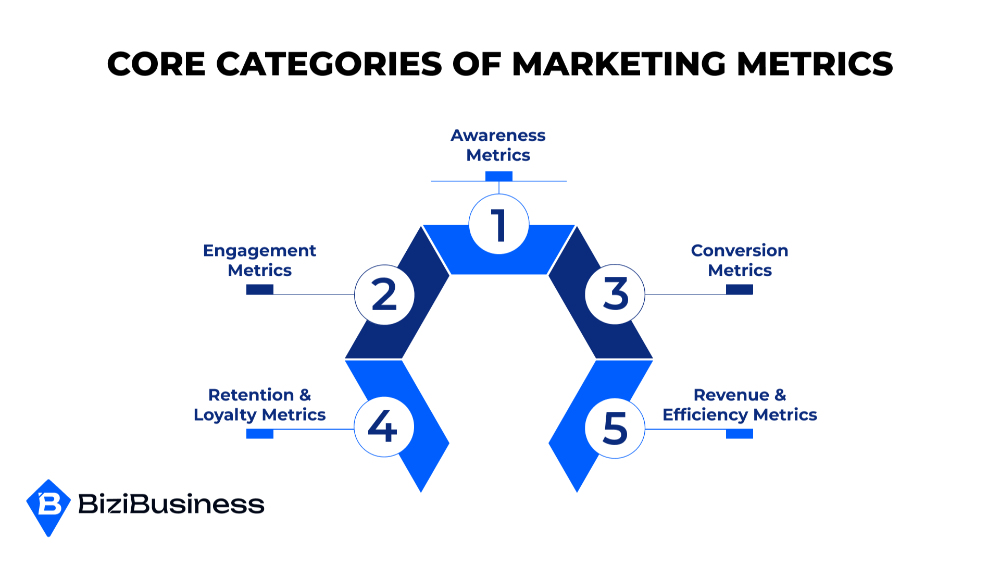
To make sense of your data, you need to group it by what it actually tells you. Not all metrics belong in the same conversation. The most effective marketing strategies organize analytics by funnel stage or goal type, which makes it easier to optimize and act.
Here are the core categories every marketing team should be tracking:
1. Awareness Metrics
These show how many people are seeing your brand, content, or campaigns.
- Impressions – How many times your content was displayed
- Reach – Unique users who saw your content
- Traffic Sources – Where your visitors are coming from (organic, paid, direct, social)
- Share of Voice (SOV) – How visible your brand is vs. competitors in a given channel or topic
These numbers help answer: Are we getting noticed?
2. Engagement Metrics
These show whether your audience is paying attention—and interacting.
- Click-Through Rate (CTR) – Clicks divided by impressions
- Bounce Rate – Percentage of visitors who leave after one page
- Time on Site/Page – How long users are staying
- Likes, Comments, Shares, Saves – On social or content platforms
These help answer: Is our content resonating?
3. Conversion Metrics
This is where action happens—leads, signups, purchases, and more.
- Conversion Rate (CVR) – % of users who take a desired action
- Cost Per Lead (CPL) – Total spend divided by new leads
- Customer Acquisition Cost (CAC) – Total cost to acquire a customer
- Lead Quality – Measured by MQLs, SQLs, or lead scoring
These answer: Are we turning engagement stategies into results?
4. Retention & Loyalty Metrics
Growth doesn’t end at acquisition. These metrics track whether you’re keeping customers—and increasing their value.
- Churn Rate – % of customers lost over time
- Repeat Purchase Rate – % of customers who buy again
- Customer Lifetime Value (LTV) – Revenue expected from a customer over time
- Net Promoter Score (NPS) – Measures customer satisfaction and referral likelihood
These answer: Are we building long-term relationships?
5. Revenue & Efficiency Metrics
These tie your marketing efforts directly to the bottom line.
- Return on Investment (ROI) – Revenue generated vs. cost of campaign
- Return on Ad Spend (ROAS) – Revenue earned per dollar spent on ads
- Marketing Efficiency Ratio – Revenue / Total marketing spend
- Pipeline Contribution – % of sales pipeline generated by marketing
These help you answer: Is our marketing profitable?
The Metrics That Actually Move the Needle
Not all metrics are created equal. Some give you surface-level reassurance. Others give you leverage. If your goal is business growth—not just marketing activity—you need to focus on the metrics that tie directly to outcomes.
Here’s how to identify them.
1. Focus on Metrics That Influence Revenue and Retention
The best metrics answer a simple question: Does this lead to growth?
Metrics like Customer Lifetime Value (LTV), Customer Acquisition Cost (CAC), and the LTV:CAC ratio are essential for understanding the real return on your marketing investment. When it comes to influencer marketing, a ratio of 3:1 or higher means you’re on the right track. If it dips below 2:1, it’s time to rethink your spend.
Lead-to-Close Rate is another key metric—it reveals the efficiency of your funnel. If your campaigns generate a flood of leads that don’t convert, that’s not success—it’s a sign of misalignment.
2. Align Metrics to Funnel Stage and Campaign Goals
Track fewer metrics—but make them count. Instead of measuring everything everywhere, focus your attention by funnel stage:
- Top of funnel (awareness): prioritize reach and traffic quality
- Middle of funnel (engagement + intent): track email signups, content downloads, retargeting CTR
- Bottom of funnel (conversion + revenue): watch CPL, CAC, ROAS, and sales velocity
This structure keeps your analytics clean—and tied to purpose.
3. Understand the Relationship Between Metrics
Data rarely works in isolation. Engagement-to-conversion ratio, for example, shows how many interested users actually take action. If this ratio is low, your offer may be weak—or your targeting off.
Another high-impact composite: Time-on-page vs. bounce rate. High time + high bounce? Your content’s engaging but lacks next-step direction. Fix your CTA, not your topic.
4. Choose KPIs That Map to Business Objectives
Every campaign should have 1–3 primary KPIs—not a dozen metrics fighting for attention. A demand gen campaign might focus on MQLs and pipeline contribution. A product launch could prioritize click-through rate and cost per acquisition. A content campaign might track organic traffic growth and engagement depth.
The key is relevance. Choose metrics that give you actionable feedback on whether your strategy is working—and what needs to change.
Common Pitfalls: What NOT to Track (or Obsess Over)
One of the biggest challenges in marketing analytics isn’t a lack of data—it’s too much of the wrong kind. When you measure everything, you dilute your focus and waste energy on numbers that don’t move the business forward.
Here’s what to stop tracking—or at least stop obsessing over:
1. Vanity Metrics That Don’t Tie to Action
High page views, social likes, or video plays can feel good—but if they don’t correlate with conversions, sales, or retention, they’re just noise. Unless you’re running an awareness-only campaign, impressions and followers mean little without engagement and outcomes.
Track these as context, not success indicators.
2. Overemphasis on Early-Stage Data
Clicks, open rates, and bounce rates are useful for diagnosing early engagement—but they’re not the finish line. Many marketers over-optimize content or ads based on these surface stats and lose sight of what happens after the click.
Measure what happens next: conversions, quality of leads, time to close, retention.
3. Tracking Too Many KPIs at Once
It’s tempting to build a dashboard with 20+ metrics to “cover your bases,” but more data often means less clarity. When everything is important, nothing is. Focus on a few key indicators per campaign or funnel stage—and tie them directly to business objectives.
4. Misreading Correlation as Causation
Just because two metrics rise or fall together doesn’t mean one caused the other. For example, seeing more traffic during a campaign doesn’t prove the campaign worked unless you track attribution and compare against benchmarks.
Dig deeper before drawing conclusions—or adjusting budgets.
5. Ignoring the Cost Side of the Equation
Many teams focus on output metrics (leads, traffic, sales) without factoring in what it took to get them. Always pair performance with cost:
- Leads → Cost per lead
- Revenue → ROAS
- Content engagement → Time or dollars spent producing it
Efficiency matters as much as volume when it comes to scalable growth.
Avoiding these traps will sharpen your strategy, improve your reporting, and give your team a clearer path from data to decision.
Tools of the Trade: Top Analytics Platforms by Function
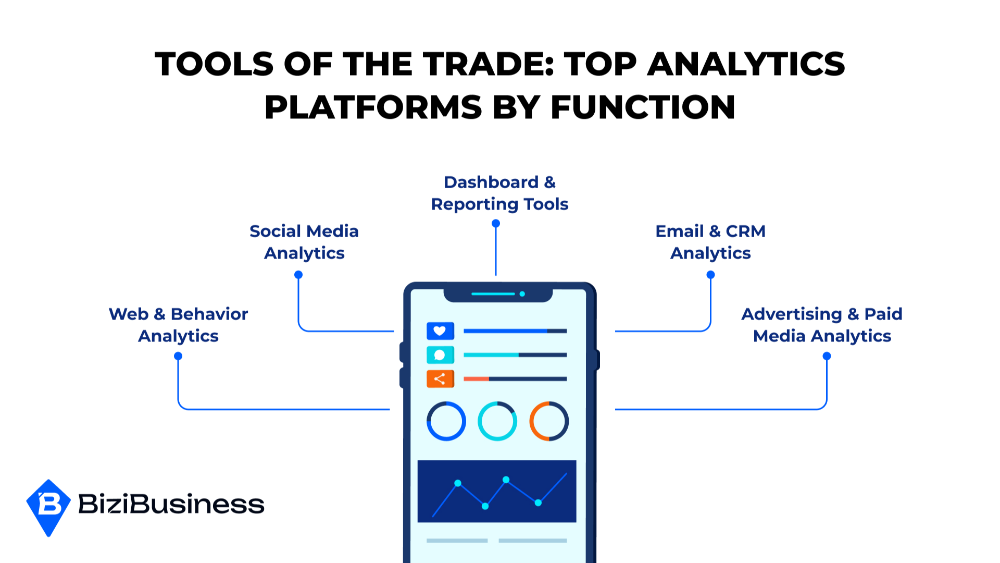
Choosing the right metrics is half the battle. The other half? Using the right tools to track, visualize, and act on them. Below are some of the most effective analytics of social media platforms—organized by marketing function—to help you build a stack that supports real decision-making.
1. Web & Behavior Analytics
Google Analytics 4 (GA4)
The industry standard for tracking user behavior on your site. GA4 offers deeper event-based tracking, cross-device insights, and predictive metrics like purchase probability.
Best for: Traffic sources, user journeys, conversion tracking
Hotjar
Heatmaps, scroll depth, session recordings, and surveys to understand how users actually interact with your site.
Best for: UX optimization, friction analysis
Adobe Analytics
Enterprise-level behavioral tracking with advanced segmentation and real-time data processing.
Best for: Large-scale businesses with complex tracking needs
2. Social Media Analytics
Sprout Social
All-in-one social media management with analytics, scheduling, and audience insights across platforms.
Best for: Reporting social ROI, benchmarking engagement, team workflows
Metricool
A great option for startups and SMBs—provides posting tools, performance dashboards, and link tracking in a clean UI.
Best for: Simple, budget-friendly multi-platform reporting
Native Tools (Meta Insights, Twitter Analytics, LinkedIn Analytics)
Still incredibly valuable for detailed post-level data and platform-specific engagement benchmarks.
3. Email & CRM Analytics
HubSpot
Combines email, CRM, landing page, and campaign reporting in one dashboard. Great for lifecycle tracking.
Best for: Lead funnel attribution, nurturing campaigns, MQL insights
Klaviyo
Ecommerce-friendly email platform with built-in revenue attribution and predictive analytics.
Best for: Shopify and DTC brands
Mailchimp
Straightforward reporting for open rates, click rates, and audience growth.
Best for: Small business newsletters and campaign testing
4. Advertising & Paid Media Analytics
Meta Ads Manager & Google Ads
Both offer deep campaign-level insights like impressions, CTR, CPC, conversions, and ROAS.
Best for: Real-time ad optimization and budget allocation
Revealbot
Automates ad reporting, rules-based bid management, and cross-platform ROAS dashboards.
Best for: Scaling campaigns while minimizing manual adjustments
Supermetrics
Connects ad platforms (and others) to Looker Studio, Excel, or BigQuery for automated data pulls and unified dashboards.
Best for: Multi-channel performance aggregation
5. Dashboard & Reporting Tools
Looker Studio (formerly Google Data Studio)
Free, flexible dashboarding tool that integrates with GA4, Google Sheets, and more.
Best for: Custom visual reporting and sharing results with stakeholders
Databox
Pre-built dashboards with smart alerts and goal tracking for KPIs across marketing, sales, and product.
Best for: Mid-sized teams that want fast insights without manual setup
Klipfolio
Highly customizable dashboards for teams that want deep data control.
Best for: Agencies, consultants, or performance-driven teams
Building a High-Impact Marketing Dashboard
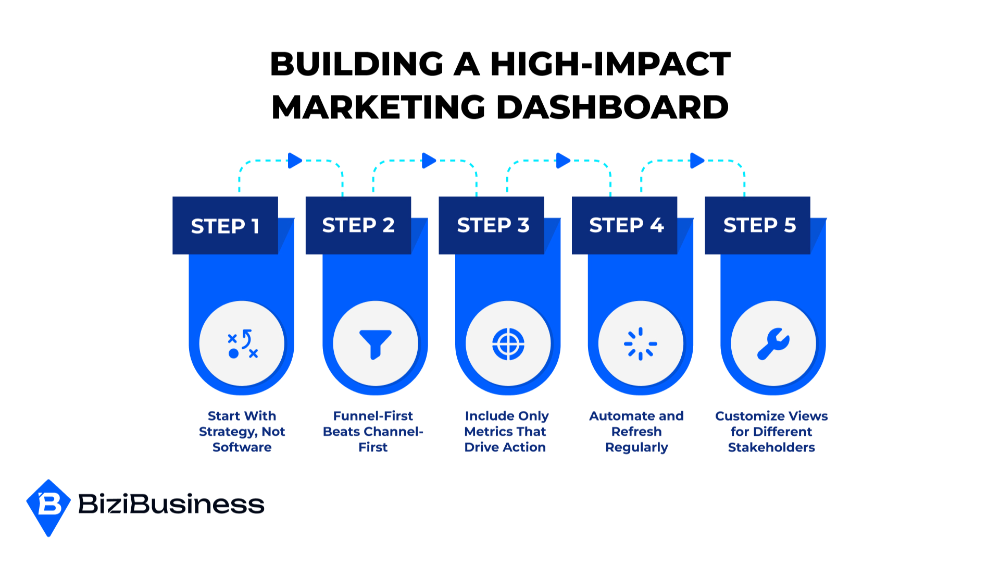
A dashboard is more than a collection of charts—it’s your marketing control panel. When built right, it gives you clarity, speed, and confidence. When built wrong, it overwhelms your team with data they can’t use.
Here’s how to build one that actually drives action.
1. Start With Strategy, Not Software
Before choosing widgets or visualizations, define what the dashboard needs to answer:
- What are our business goals this quarter?
- What does success look like for each stage of the funnel?
- Who needs to see this data—and why?
Dashboards should be designed around decisions, not just reporting.
2. Funnel-First Beats Channel-First
Many marketers organize dashboards by channel (Google Ads, email, social). But this often leads to fragmented insights. A better approach: structure your dashboard by funnel stages—awareness, engagement, conversion, retention.
This lets you:
- See how users move through the customer journey
- Identify drop-offs or bottlenecks
- Understand how each channel contributes to pipeline and revenue
3. Include Only Metrics That Drive Action
Don’t clutter the screen with every available metric. Focus on the critical few:
- 1–2 KPIs per funnel stage
- Benchmarks to contextualize performance
- Trends over time, not just snapshots
Ask for every metric: If this number goes up or down, will we do something differently? If not, remove it.
4. Automate and Refresh Regularly
Manual reporting wastes hours and increases risk of error. Use tools like Looker Studio, Supermetrics, or Databox to automate data pulls and refresh metrics on a weekly or real-time basis.
Set up scheduled snapshots for:
- Weekly team check-ins
- Monthly strategy reviews
- Quarterly board or leadership reports
5. Customize Views for Different Stakeholders
Your CMO doesn’t need the same data as your paid media manager. Build multiple views, or filters, based on audience:
- Executive view: revenue, ROI, trends
- Channel manager view: campaign-level insights
- Analyst view: granular source data for deeper dives
From Insights to Action: How to Actually Use Your Data
Your dashboard from various social media tools might be packed with impressive charts, but if it’s not driving decisions, it’s just digital wallpaper. The real value of marketing analytics is its power to inform strategy, inspire change, and improve outcomes. Turning that insight into action is where most teams fall short—and where the best marketers separate themselves.
Here’s how to go beyond observing data—and start using it to build momentum.
1. Look for Trends, Not One-Off Wins or Losses
It’s easy to get excited about a sudden spike in traffic or panic over a temporary drop in leads. But strong strategy is built on trends, not flukes. When reviewing your metrics, zoom out. Ask:
- Is this a consistent upward (or downward) movement?
- Has this happened before under similar conditions?
- Does this pattern align with changes in campaigns, content, or spend?
For example, a steady month-over-month increase in engagement on educational posts could signal a content direction worth expanding. But one viral post? Great—but not necessarily a repeatable tactic.
2. Build a Monthly Review and Optimization Rhythm
Many marketers treat reporting as a finish line. In reality, it’s the start of the next sprint. Create a consistent cadence—weekly for fast-moving campaigns, monthly for strategic reviews—where the team evaluates performance with intent.
In each review session:
- Flag 2–3 standout wins or losses
- Dig into the why behind them
- Turn each insight into a test, adjustment, or scale-up plan
- Assign an owner and timeline to each action
Without follow-up, insight becomes shelfware. Make analysis part of your team’s workflow—not a passive check-in.
3. Prioritize Insights With Financial Impact
Not all optimizations are worth equal effort. Focus on improvements that touch the bottom line:
- Where can you lower Customer Acquisition Cost (CAC) without hurting volume?
- Are there content pieces or ad sets driving above-average ROAS that deserve more budget?
- Are there funnel stages where lead drop-off is hurting pipeline velocity?
Use metrics to spot opportunities that improve revenue, efficiency, or retention. Everything else can wait.
4. Connect the Dots Across Channels and Teams
Your data doesn’t live in silos—and neither should your decisions. For example:
- If paid ads drive traffic but email fails to convert, the problem may be offer positioning—not traffic quality.
- If engagement is high but lead quality is low, you might be attracting the wrong audience altogether.
Encourage collaboration between content creation, paid, lifecycle, and sales teams. Use your dashboard as a conversation tool, not just a scorecard. That’s where insights turn into alignment—and alignment fuels results.
5. Pair Every Metric With a Narrative
Numbers alone rarely motivate action. Instead of dropping charts in a report, write a one-sentence interpretation for each:
- “CTR on our lead magnet campaign dropped by 28%—likely due to new headline testing. We’ll revert to the control copy this week.”
- “Email click rates jumped 12% after we added video previews—worth testing in our next nurture series.”
Insights become actionable when they’re explained with clarity, context, and confidence. Data literacy = marketing leadership.
6. Know When to Test, Tweak, or Trash
Not every dip is a disaster—and not every bump is a breakthrough. Let your analytics guide your response:
- Test when the data suggests potential but lacks scale or consistency
- Tweak when performance is solid but not maximizing ROI
- Trash when a tactic or channel consistently underperforms, even after testing
Analytics Without Action Is Just Noise
Data on its own isn’t a strategy. It’s a signal. A starting point. A mirror that shows you what’s working, what’s failing, and where you’re leaving money on the table. But without action, even the clearest insights fade into background noise.
That’s the difference between good marketers and great ones: good marketers track, great marketers act.
Great marketers simplify. They focus on the metrics that move the business forward—CAC, LTV, conversion rates, and revenue impact—not just traffic, likes, or open rates. They build dashboards that tell a story. They meet regularly to review performance with purpose. And they don’t wait for perfect data—they use the best available information to make decisions quickly and improve iteratively.
Here’s the truth: you don’t need more data. You need to be more decisive with the data you already have. Whether you’re launching a campaign, scaling spend, or refining your funnel—analytics should be the tool you use to move with clarity, not hesitation.
So don’t let your reports sit unread. Use them. Challenge them. Share them. Turn them into actions. That’s how analytics drives ROI—not as a scoreboard, but as your roadmap.
FURTHER READING


Subscribe to Newsletter
Unlock your creativity and stay up to date on marketing tips